
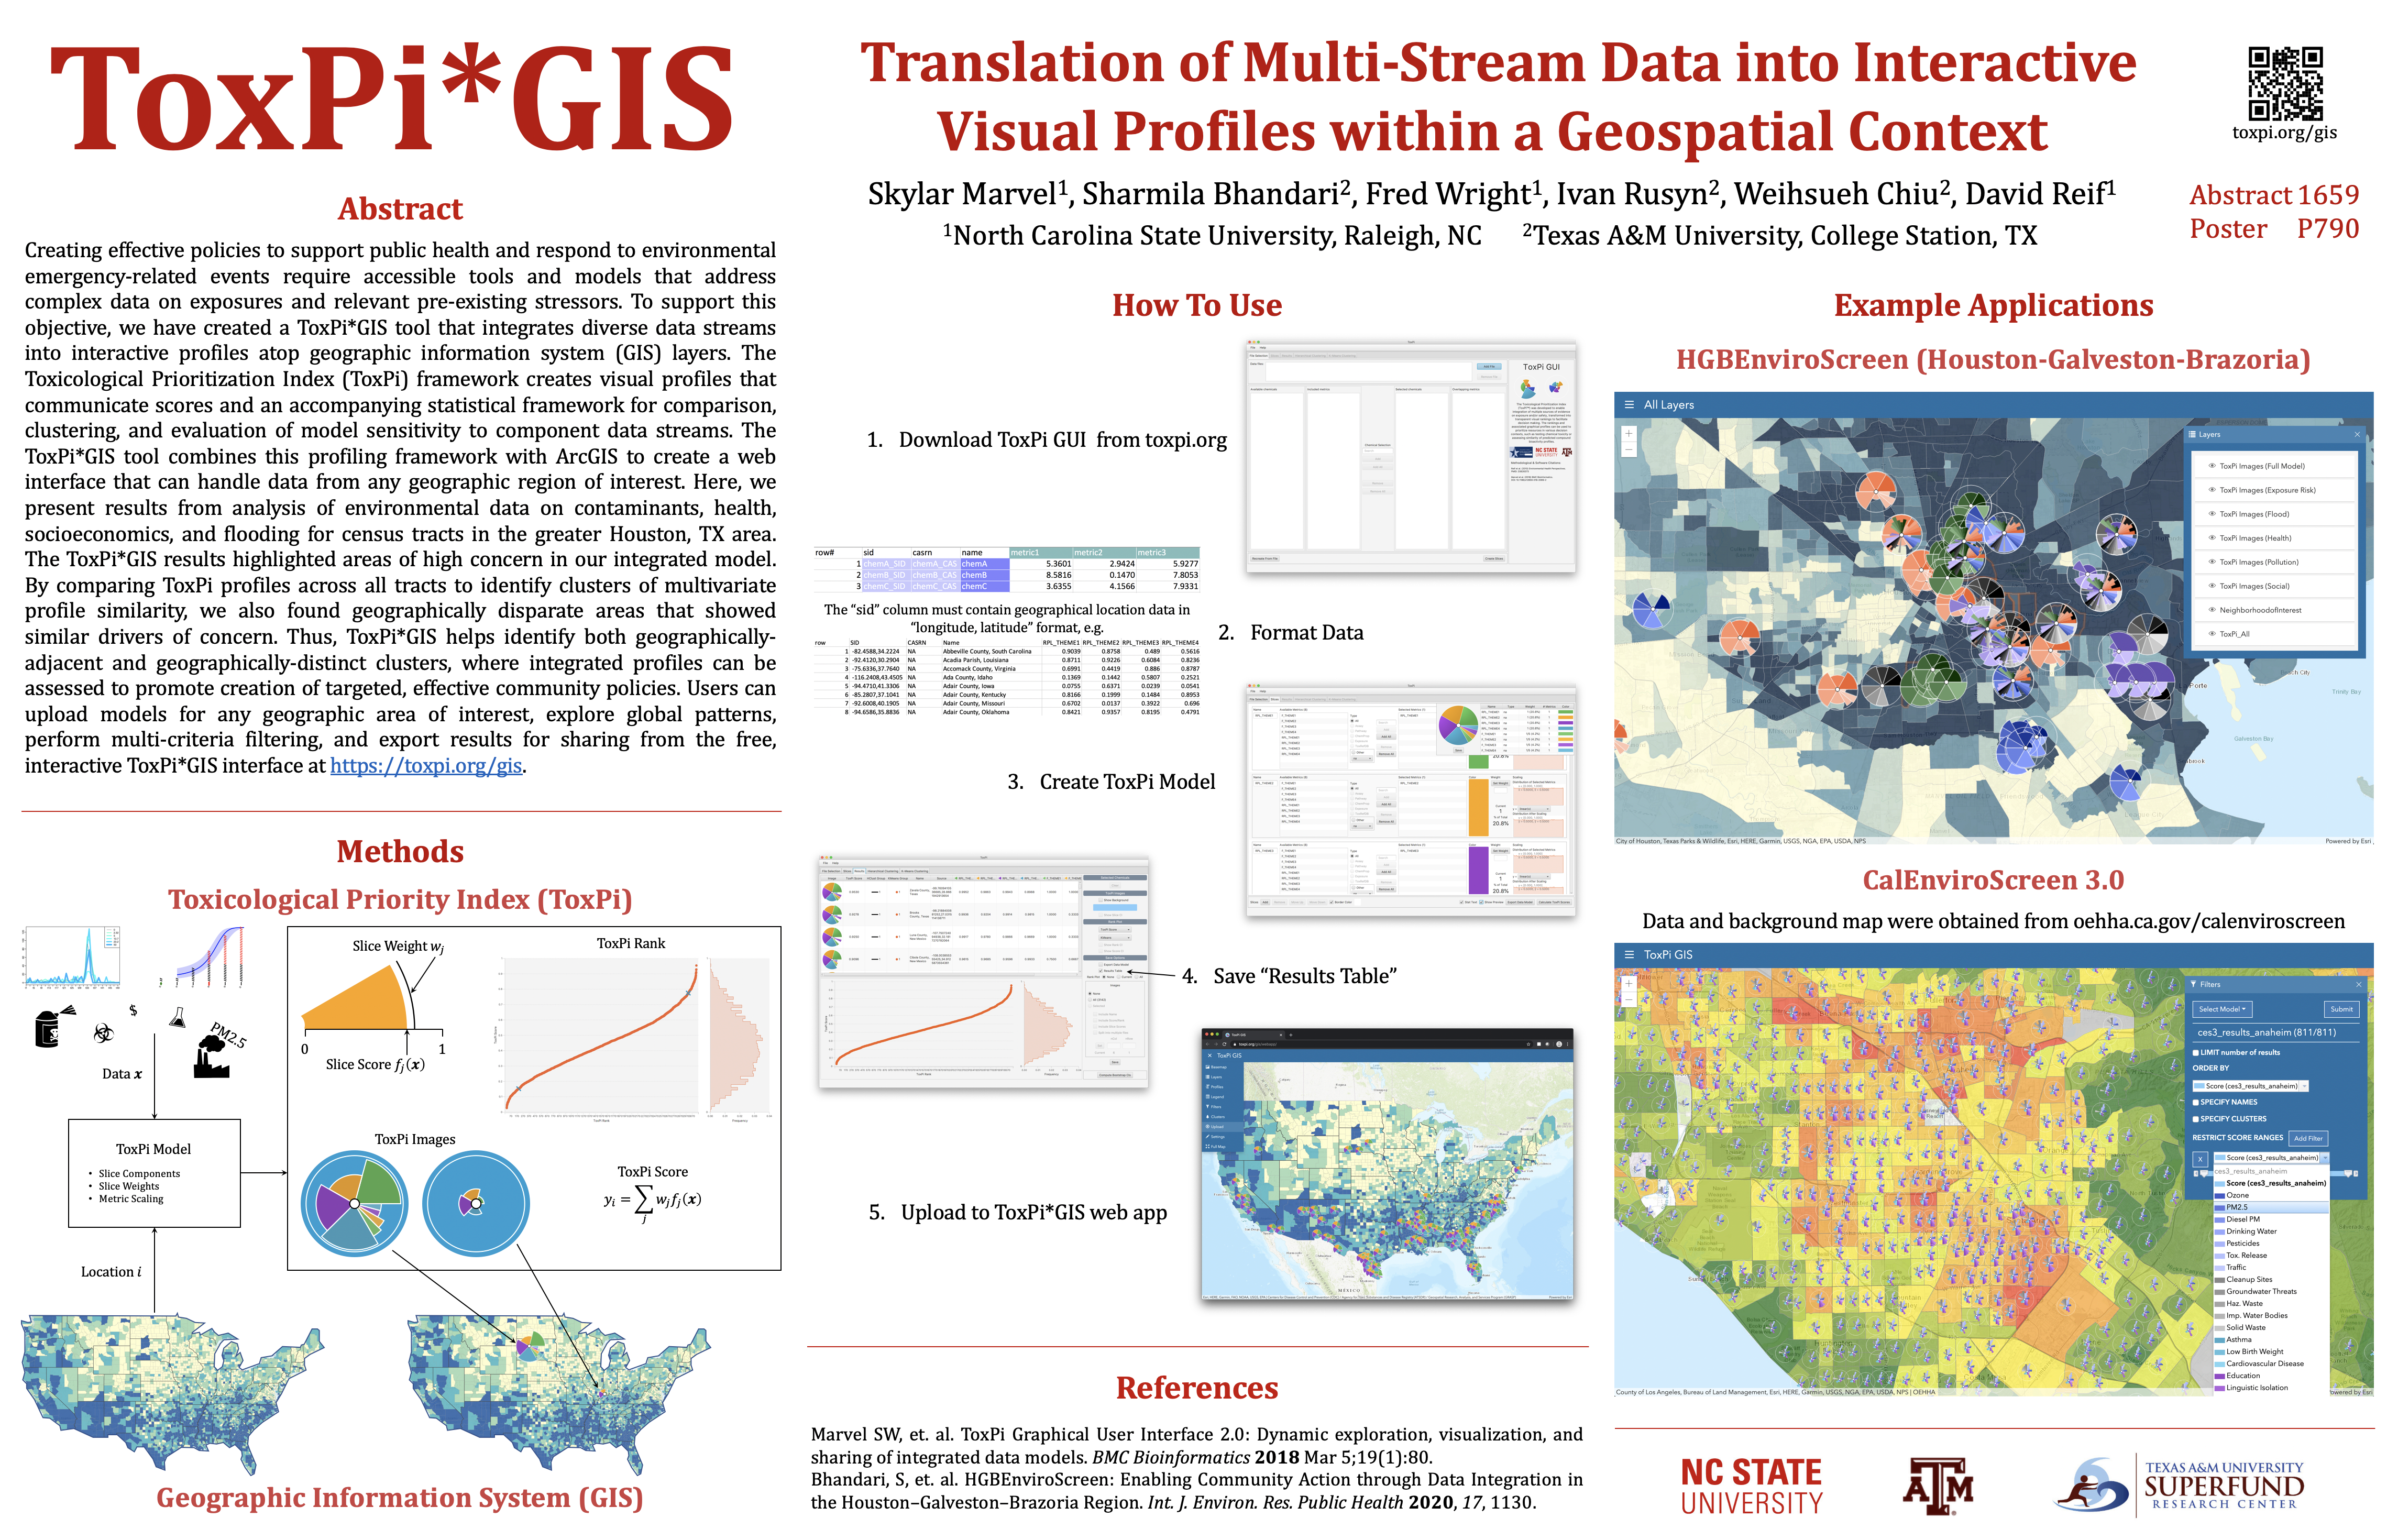
ToxPi*GIS integrates diverse data streams into interactive, visual profiles atop any geographic information system (GIS) layers of interest. Click to access the ToxPi*GIS web app 

Citation
Marvel, Bhandari, Wright, Rusyn, Chiu, and Reif. ToxPi*GIS: Translation of multi-stream data into interactive visual profiles within a geospatial context. Society of Toxicology Annual Meeting, 2020. Abstract 1659.
Tutorials
Adjust display
Filter results by cluster, score, or region
Identify clusters
Explore profile detail
Share models
Example data
Social Vulnerability Index
Portal ID:
7844b1987e7c4eeba063b09e980d99a6
CalEnviroScreen
Portal ID:
0db22c1560b347508dec7873b97bd34a
Funding